strick Posted December 18, 2022 Author Share Posted December 18, 2022 13 hours ago, PSPR said: Strick, CD has reported that he is getting excessive falsing with the Manticore in older sites with old iron nails. Have you experienced a lot of falsing around heavy iron or nails? I have only hunted parks not relic sites yet. Baby steps. Plus I wanna find a gold ring lol. I'm thinking about going to a relic site this afternoon and see how it does. It would be a miracle to find a silver coin there as it's been so hunted. Falsing is something the CTX did as well but easy for me to at least get over and tell the difference easily between a nail falsing and a good target. I seen part of that video and at least one of the users did not know what button did what on the machine. Trying to learn a new machine in a nail infested site is not a good place to start lol. strick Link to comment Share on other sites More sharing options...
strick Posted December 18, 2022 Author Share Posted December 18, 2022 7 hours ago, Chase Goldman said: It's what concerned me about ML expanding the scale. Repeatability might suffer. We'll see how it plays out on the Nox 900. Yes it is what made the Nox user friendly having the lower scale. Your brain dont have to work so hard...there will be some that will want their old Nox 800's back. Some of the guys here are saying that nickels are a 12-13 on the Nox which is what I was familur with as well ...on the manticore they are a 25-29 now. strick Link to comment Share on other sites More sharing options...
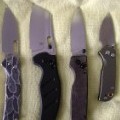
strick Posted December 18, 2022 Author Share Posted December 18, 2022 1 hour ago, Chase Goldman said: Thanks. Hard for my brain to view and interpret it in that manner because its trying to interpret the horizontal aspect . It would be interesting then to plot them as a more ordered histogram with the vdi along the horizontal axis and total discrete targets per vdi while retaining the color coding for target type rather than scattered. I might do that and see what it looks Even more interesting if the data included "above, below, or right on top of" the target trace line. I'm glad you guys are doing this as it makes it easier to interpret..I will note that all of the targets were checked at least twice and some of the outliers at three times to make sure the VID was the same each time...all were held in a flat orientation and waved about 3 inches over the top of the coil. Also you wil see a couple zinc pennies cut in half in the photo....I did not test those only whole zinc pennies. strick Link to comment Share on other sites More sharing options...
strick Posted December 18, 2022 Author Share Posted December 18, 2022 7 hours ago, dsb said: target trace location? In the middle these are air tests....the manticore will ID Non ferrous on the middle line unless it is next to ferrous which will pull it away from the middle line depending on how close it is to the ferrous target. strick Link to comment Share on other sites More sharing options...
jasong Posted December 18, 2022 Share Posted December 18, 2022 7 hours ago, Chase Goldman said: Thanks. Hard for my brain to view and interpret it in that manner because its trying to interpret the horizontal aspect . It would be interesting then to plot them as a more ordered histogram with the vdi along the horizontal axis and total discrete targets per vdi while retaining the color coding for target type rather than scattered. I might do that and see what it looks Even more interesting if the data included "above, below, or right on top of" the target trace line. This is about the closest I get to that with Google Sheets, I can't find a setting to reduce the "clumping" so that there is more resolution and more individual data points available so that you can really see the exact VDI ranges for each type of target. It also doesn't really let me set specfic hash mark intervals so it sticks me with the random numbers you see on the X axis (fractional VID #'s are meaningless). I don't have Excel on this computer, even though I've paid for like 4 times, argh. Well anyways, this is the best I can do with this program. To me the scatter plot shows the individual data better. But I'm also really used to looking at scatter plots for other things, and human brains are notoriously bad at finding and/or misinterpreting trends in data. What I see when I look at the scatter plot like this one is just clumped populations, in other words the VID range where the majority of the population resides. Like this (btw, gold is the hardest to clump since it has so many outliers): And again you can do it with pull tabs too (I didn't draw round/tail tabs on, but their zone would be about 35-45): For me, I'm just so used to looking at scatter plots that I see data trends right away. But I forget that it isn't as readily apparant for people that don't look at stuff like this all the time. *BTW - you could also say there is a "Big Gold Zone" (need more data first) around 45-55 VDI too (and potentially a 3rd even higher but we lack data there), instead of looking at them as outlier, because there is a trend there based on this data. Which I guess might be another way to cherry pick gold rings if one wanted to really miss all the pull tabs and lower VDI trash. It also shows what Strick already knew and said - which is that for nice, larger gold rings you gotta dig the zincs, period. So in other words - for cherry picking - One would get the large majority of gold rings and avoid the most possible trash while getting them, by hunting for 12-32 and 45-55 VDI targets. Based on this data anyways. You can adjust the zone lines up and down to suit your particular desire to miss or dig X amount of each type of target though. For instance, 12-20 VDI only would be ultra cherry picking. Link to comment Share on other sites More sharing options...
GB_Amateur Posted December 18, 2022 Share Posted December 18, 2022 2 hours ago, jasong said: So in other words - for cherry picking - One would get the large majority of gold rings and avoid the most possible trash while getting them, by hunting for 12-32 and 45-55 VDI targets. Based on this data anyways. You can adjust the zone lines up and down to suit your particular desire to miss or dig X amount of each type of target though. For instance, 12-20 VDI only would be ultra cherry picking. I see a potential problem here: how representative are strick's gold rings? It does appear in your plots that there's a 'DMZ' but is that a real effect or a selection effect? Thanks for plotting this stuff up, Jason. LibreOffice is a free alternative and (apparently) closer to MS-Office than Google docs. In my case I have multiple computers and OS's so I can still work in what I learned long ago (MS-Excel) and import into LibreOffice to be able to do a few things (like easily print, e-mail, etc.). But I wouldn't recommend that anyone copy me! I'm like that guy who mows his lawn with scythe and clears deep snow with a broom. 😁 Link to comment Share on other sites More sharing options...
phrunt Posted December 18, 2022 Share Posted December 18, 2022 You can use MS Office free these days by using it online if you don't own it. https://www.microsoft.com/en-us/microsoft-365/free-office-online-for-the-web Plenty of free alternatives like Open Office though. Link to comment Share on other sites More sharing options...
jasong Posted December 18, 2022 Share Posted December 18, 2022 20 minutes ago, GB_Amateur said: I see a potential problem here: how representative are strick's gold rings? It does appear in your plots that there's a 'DMZ' but is that a real effect or a selection effect? Thanks for plotting this stuff up, Jason. LibreOffice is a free alternative and (apparently) closer to MS-Office than Google docs. In my case I have multiple computers and OS's so I can still work in what I learned long ago (MS-Excel) and import into LibreOffice to be able to do a few things (like easily print, e-mail, etc.). But I wouldn't recommend that anyone copy me! I'm like that guy who mows his lawn with scythe and clears deep snow with a broom. 😁 Absolutely - that's why I said something like "based on this data". 🙂 Ideally we'd have like 10 people across the country providing similar data so that we can average it out a bit better. As it stands, this is still highly selective data and even though Strick did a metric s-ton of measurements (that stuff takes time/patience), we'd really need like 10x that amount to really narrow down the trends with a higher confidence. So, this is all just rough ideas - people's own field experience can fill in the blanks! It's that "feel" everyone develops after running a detector long enough. Best snow shovel made is a metal scoop shovel for livestock feed/manure. 🙂 Link to comment Share on other sites More sharing options...
Dug D Posted December 18, 2022 Share Posted December 18, 2022 More data is better, but there is great info here, that will help me for sure. Thanks for all the work. 🙂 Link to comment Share on other sites More sharing options...
TampaBayBrad Posted October 24, 2023 Share Posted October 24, 2023 On 12/18/2022 at 4:19 PM, jasong said: Ideally we'd have like 10 people across the country providing similar data so that we can average it out a bit better. As it stands, this is still highly selective data and even though Strick did a metric s-ton of measurements (that stuff takes time/patience), we'd really need like 10x that amount to really narrow down the trends with a higher confidence. So, this is all just rough ideas - people's own field experience can fill in the blanks! It's that "feel" everyone develops after running a detector long enough. Best snow shovel made is a metal scoop shovel for livestock feed/manure. 🙂 Interesting. This data is quite a bit different than what I've been seeing at the beaches using Beach Modes. I came across this older December thread because strick posted a link in the "zinc pennies vs. gold rings" thread. My crusty zincs and even fresh zincs have been around 80% 59-63. Some stray into the 70's, but not that many at all. Pull tabs can vary a bit more depending on the style tab, but I would say 80% have been 29-33. This is a much more condensed VID range than what strick is seeing. Much easier for me to call a zinc or pull tab before I dig it than what is shown in the graphs above. I can also pretty much call a dime or quarter nearly every time before digging. A dime is around 79-82 and a quarter 89-91. Nickels are almost always 25-27. I wonder if Beach modes (I use beach low conductors and surf and seawater only) are that much better at identifying targets or if it's just because of the hotter ground conditions strick has and not so much the search modes we are using? Link to comment Share on other sites More sharing options...


Recommended Posts
Create an account or sign in to comment
You need to be a member in order to leave a comment
Create an account
Sign up for a new account in our community. It's easy!
Register a new accountSign in
Already have an account? Sign in here.
Sign In Now